Data analysis is of no use until we present it in understandable manner.
And charts are most efficient and conventional way of showing meaning of data.
Here we're going to use the Python library matplotlib to create some graphical charts based on our data.
Output
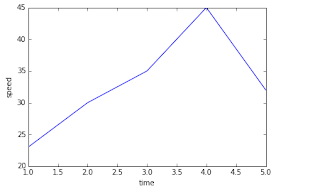 Here is your neat and clean time vs speed chart.
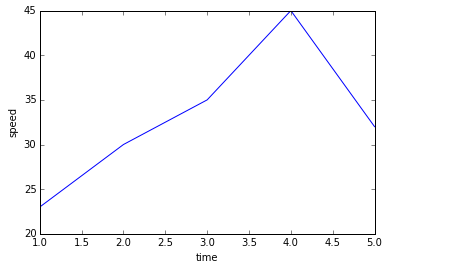
If you look at the code, we are importing pyplot module from matplotlib package.
plt.plot() commands take x and y axis values as input and plot the graph.
We can further name axis using xlabel() and ylabel() function.
One more sample problem:
Please refer problem section of my earlier Text analysis with python blog.
There you would see two parameters,
- Variety of radish
- Number of votes for each variety of radish
Now we will try to plot a bar graph of the same where x='Variety of radish'
y='Number of Votes'
See below code snippet
Please note that before running below code, I have already created one dictionary object 'count' containing variety of radish as key and number of votes as value.Refer Text analysis with python blog(code 4)
And here is your bar plot,

Try your hands on this Problem.
Happy learning !!!
Sample graph of Time vs Speed
Lets take
one simple example to understand how graphs are plotted using matplotlib.
I have two
list of values,
1.Time in
hours – 1,2,3,4,5
2. Speed in
mph - 23, 30, 35, 45, 32
Now we will
plot a simple chart having Time on X
axis and Speed on Y axis.
 |
| Code |
Output
If you look at the code, we are importing pyplot module from matplotlib package.
plt.plot() commands take x and y axis values as input and plot the graph.
We can further name axis using xlabel() and ylabel() function.
One more sample problem:
Please refer problem section of my earlier Text analysis with python blog.
There you would see two parameters,
- Variety of radish
- Number of votes for each variety of radish
Now we will try to plot a bar graph of the same where x='Variety of radish'
y='Number of Votes'
See below code snippet
Please note that before running below code, I have already created one dictionary object 'count' containing variety of radish as key and number of votes as value.Refer Text analysis with python blog(code 4)
 |
| Code |
And here is your bar plot,

Try your hands on this Problem.
Happy learning !!!


